Introduction to datetime#
In solar photovoltaic problems, it is very common to have data whose index involves dates and times. For this using the DateTimeIndex is very useful.
Note
If you have not yet set up Python on your computer, you can execute this tutorial in your browser via Google Colab. Click on the rocket in the top right corner and launch “Colab”. If that doesn’t work download the .ipynb file and import it in Google Colab.
Then install pandas and numpy by executing the following command in a Jupyter cell at the top of the notebook.
!pip install pandas numpy
import pandas as pd
import numpy as np
We can create a time index by indicating the start, frequency and the number of periods.
time = pd.date_range(start="2024-01-01",
                           periods=365,
                           freq='D')
We can also use the start, frequency and end.
time = pd.date_range(start="2024-01-01",
                     end="2026-01-01",
                     freq="D")
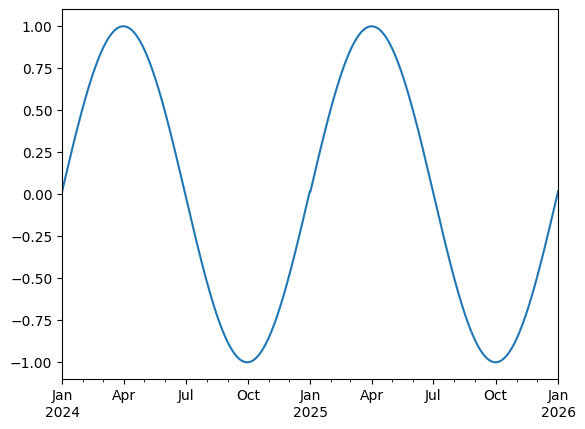
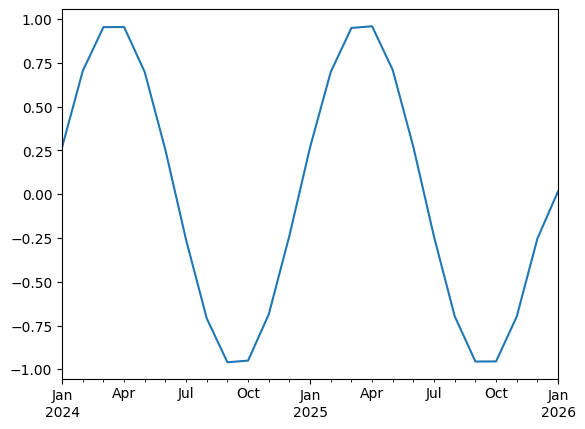
We can use the time index to create a series and plot it.
values = np.sin(2 * np.pi * time.dayofyear / 365)
ts = pd.Series(values, index=time)
ts.plot()
<Axes: >
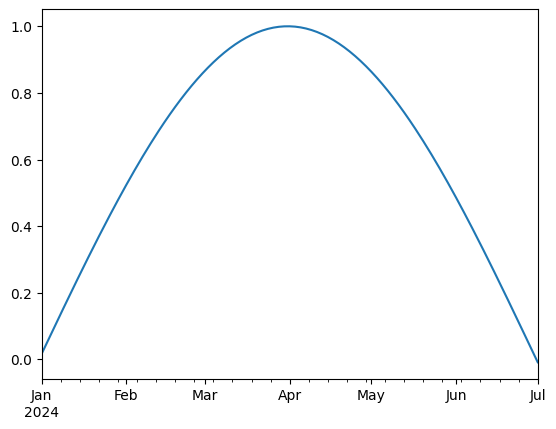
We can use Python’s slicing notation inside .loc to select a date range.
ts.loc["2024-01-01":"2024-07-01"].plot()
<Axes: >
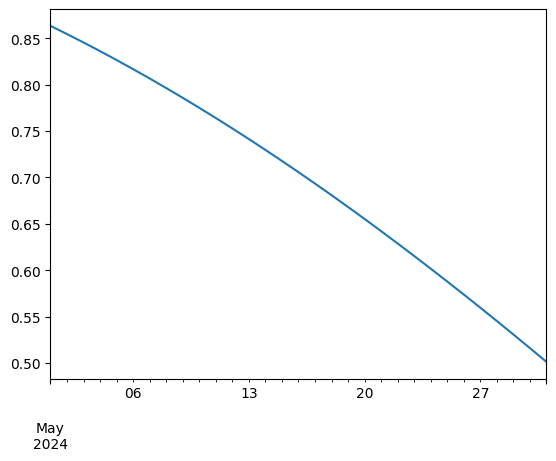
ts.loc["2024-05"].plot()
<Axes: >
The pd.TimeIndex object has lots of useful attributes
ts.index.month
Index([ 1,  1,  1,  1,  1,  1,  1,  1,  1,  1,
       ...
       12, 12, 12, 12, 12, 12, 12, 12, 12,  1],
      dtype='int32', length=732)
ts.index.day
Index([ 1,  2,  3,  4,  5,  6,  7,  8,  9, 10,
       ...
       23, 24, 25, 26, 27, 28, 29, 30, 31,  1],
      dtype='int32', length=732)
Another common operation is to change the resolution of a dataset by resampling in time. Pandas exposes this through the resample function. The resample periods are specified using pandas offset index syntax.
Below we resample the dataset by taking the mean over each month.
ts.resample("M").mean().head()
/tmp/ipykernel_3790/3719689167.py:1: FutureWarning: 'M' is deprecated and will be removed in a future version, please use 'ME' instead.
  ts.resample("M").mean().head()
2024-01-31    0.268746
2024-02-29    0.704299
2024-03-31    0.954333
2024-04-30    0.955056
2024-05-31    0.697250
Freq: ME, dtype: float64
ts.resample("M").mean().plot()
/tmp/ipykernel_3790/2719797856.py:1: FutureWarning: 'M' is deprecated and will be removed in a future version, please use 'ME' instead.
  ts.resample("M").mean().plot()
<Axes: >
We can now import the same file from previous introduction containing data measured at a weather station, and make its index a DateTimeIndex
fn = "weather_station_data.csv"
df = pd.read_csv(fn, index_col=0)
df.index = pd.to_datetime(df.index, utc=True)
df.index
DatetimeIndex(['2024-01-01 00:00:00+00:00', '2024-01-01 00:05:00+00:00',
               '2024-01-01 00:10:00+00:00', '2024-01-01 00:15:00+00:00',
               '2024-01-01 00:20:00+00:00', '2024-01-01 00:25:00+00:00',
               '2024-01-01 00:30:00+00:00', '2024-01-01 00:35:00+00:00',
               '2024-01-01 00:40:00+00:00', '2024-01-01 00:45:00+00:00',
               ...
               '2024-07-01 23:10:00+00:00', '2024-07-01 23:15:00+00:00',
               '2024-07-01 23:20:00+00:00', '2024-07-01 23:25:00+00:00',
               '2024-07-01 23:30:00+00:00', '2024-07-01 23:35:00+00:00',
               '2024-07-01 23:40:00+00:00', '2024-07-01 23:45:00+00:00',
               '2024-07-01 23:50:00+00:00', '2024-07-01 23:55:00+00:00'],
              dtype='datetime64[ns, UTC]', length=52704, freq=None)
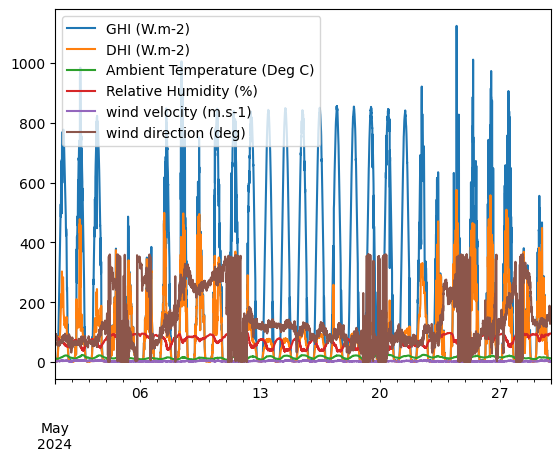
We can define a time series and use it to select data within the database.
start_date = '2024-05-01 00:00:00'
end_date = '2024-05-30 00:00:00'
time_index= pd.date_range(start=start_date,
end=end_date,
freq='5min',
tz='UTC')
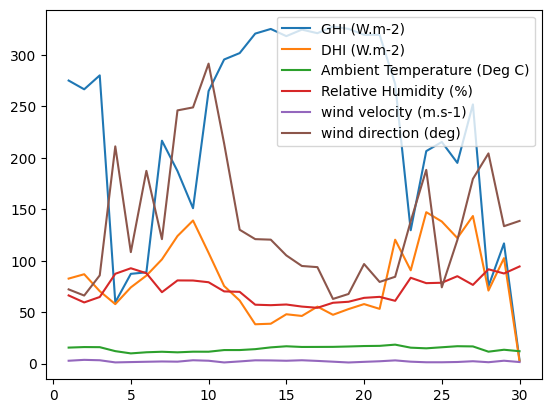
df.loc[time_index].plot()
<Axes: >
We can also group the values per day, average them and plot them.
df.loc[time_index].groupby(df.loc[time_index].index.day).mean().plot()
<Axes: >