
Problem 2.4#
Fundamentals of Solar Cells and Photovoltaic Systems Engineering
Solutions Manual - Chapter 2
Problem 2.4
Using the tabulated data provided in the online repository of this book, estimate the UV content (280–400 nm) and the total irradiance in the extraterrestrial reference spectrum AM0, the global reference spectrum AM1.5G, and the direct reference spectrum AM1.5D.
We will use the package pandas to handle the data and matplotlib.pyplot to plot the results
import pandas as pd
import numpy as np
import matplotlib.pyplot as plt
We start by importing the data.
datafile = pd.read_csv('data/Reference_spectrum_ASTM-G173-03.csv', index_col=0, header=0)
datafile
| AM0 | AM1.5G | AM1.5D | |
|---|---|---|---|
| Wvlgth nm | Etr W*m-2*nm-1 | Global tilt W*m-2*nm-1 | Direct+circumsolar W*m-2*nm-1 |
| 280 | 8.20E-02 | 4.73E-23 | 2.54E-26 |
| 280.5 | 9.90E-02 | 1.23E-21 | 1.09E-24 |
| 281 | 1.50E-01 | 5.69E-21 | 6.13E-24 |
| 281.5 | 2.12E-01 | 1.57E-19 | 2.75E-22 |
| ... | ... | ... | ... |
| 3980 | 8.84E-03 | 7.39E-03 | 7.40E-03 |
| 3985 | 8.80E-03 | 7.43E-03 | 7.45E-03 |
| 3990 | 8.78E-03 | 7.37E-03 | 7.39E-03 |
| 3995 | 8.70E-03 | 7.21E-03 | 7.23E-03 |
| 4000 | 8.68E-03 | 7.10E-03 | 7.12E-03 |
2003 rows × 3 columns
datafile.drop(datafile.index[0], inplace=True) #remove row including information on units
datafile=datafile.astype(float) #convert values to float for easy operation
datafile.index=datafile.index.astype(float) #convert indexes to float for easy operation
We start by calculating the total irradiance AM0, AM1.5G and AM1.5D.
for spectra in ['AM0', 'AM1.5G', 'AM1.5D']:
    irradiance=np.trapz(datafile[spectra], x = datafile.index)
    print('Total irradiance in ' + spectra + ' = ' + str(irradiance.round(1)) + ' W/m2')
Total irradiance in AM0 = 1348.0 W/m2
Total irradiance in AM1.5G = 1000.5 W/m2
Total irradiance in AM1.5D = 900.2 W/m2
/tmp/ipykernel_2259/3886220376.py:2: DeprecationWarning: `trapz` is deprecated. Use `trapezoid` instead, or one of the numerical integration functions in `scipy.integrate`.
  irradiance=np.trapz(datafile[spectra], x = datafile.index)
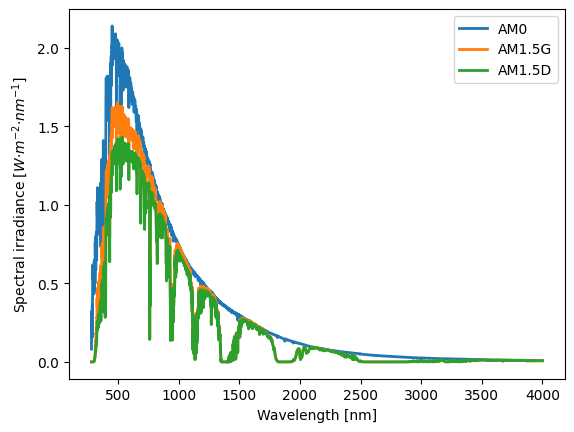
We can also plot the three spectra
plt.plot(datafile, linewidth=2, label=datafile.columns)
plt.ylabel('Spectral irradiance [$W·m^{-2}·nm^{-1}$]')
plt.xlabel('Wavelength [nm]')
plt.legend()
<matplotlib.legend.Legend at 0x7fc81b3e3450>
We calculate the UV content in AM0, AM1.5G, and AM1.5D.
index=datafile.index<=400
for spectra in ['AM0', 'AM1.5G', 'AM1.5D']:
    irradiance=np.trapz(datafile[spectra][index], x = datafile.index[index])
    print('UV irradiance in ' + spectra + ' = ' + str(irradiance.round(1)) + ' W/m2')
UV irradiance in AM0 = 102.8 W/m2
UV irradiance in AM1.5G = 46.1 W/m2
UV irradiance in AM1.5D = 30.5 W/m2
/tmp/ipykernel_2259/2576016788.py:3: DeprecationWarning: `trapz` is deprecated. Use `trapezoid` instead, or one of the numerical integration functions in `scipy.integrate`.
  irradiance=np.trapz(datafile[spectra][index], x = datafile.index[index])