Problem 9.11#
Fundamentals of Solar Cells and Photovoltaic Systems Engineering
Solutions Manual - Chapter 9
Problem 9.11
This problem represents the first step in the design of a grid-connected PV system installed on the rooftop of a dwelling at a certain location. For this example, we will select Cairo, Egypt (31.233\(^{\circ}\)N, 30.033\(^{\circ}\)E).
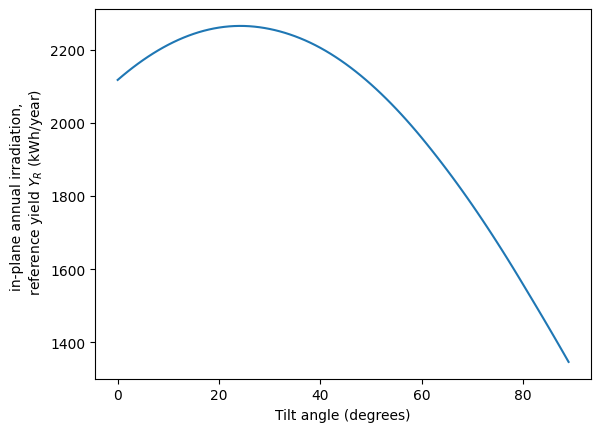
Using pvlib and retrieving the Typical Meteorological Year (TMY), find the optimum inclination for the PV generator that maximizes the reference yield. The PV generator is assumed to be oriented towards the equator.
We will use the packages pvlib, pandas and matplotlib.pyplot to plot the results. We will also use the package pytz to determine the time zone of Egypt.
import pvlib
import pandas as pd
import matplotlib.pyplot as plt
import pytz
We start by defining the location, date, and time.
# Cairo, Egypt
lat, lon =  31.233, 30.033

tz = pytz.country_timezones('EG')[0] # timezone corresponding to country 'EG' (Egypt)

# location
location = pvlib.location.Location(lat, lon, tz=tz)

orientation = 180 # pvlib sets orientation origin at North -> South=180
We retrieve typical meteorological year (TMY) data from PVGIS.
tmy, _, _, _ = pvlib.iotools.get_pvgis_tmy(latitude=lat, longitude=lon, map_variables=True)

tmy.index = tmy.index.tz_convert(tz) # use local time
We calculate the Sun’s coordinates and calculate the irradiance on the plane of array (POA)
# calculate Sun's coordinates
solar_position = location.get_solarposition(times=tmy.index)

# list of potential tilt angle
tilts=range(0,90,1)

annual_irradiation = pd.Series(index=tilts, dtype=float)

for tilt in tilts:
    # calculate irradiance at the plane of the array (poa)
    poa_irradiance = pvlib.irradiance.get_total_irradiance(surface_tilt=tilt,
                                                           surface_azimuth=orientation,
                                                           dni=tmy['dni'],
                                                           ghi=tmy['ghi'],
                                                           dhi=tmy['dhi'],
                                                           solar_zenith=solar_position['apparent_zenith'],
                                                           solar_azimuth=solar_position['azimuth'])

    #save annual irradiation on the plane of array (POA) in kWh
    annual_irradiation[tilt]=0.001*poa_irradiance['poa_global'].sum() # Wh->kWh
We can plot the annual effective irradiance (reference yield) as a function of the tilt angle.
annual_irradiation.plot()
plt.ylabel('in-plane annual irradiation, \n reference yield $Y_R$ (kWh/year)')
plt.xlabel('Tilt angle (degrees)')
Text(0.5, 0, 'Tilt angle (degrees)')

The reference yield is maximized for a tilt angle of 23 degrees.
annual_irradiation.idxmax()
24

