Problem 1.10#
Fundamentals of Solar Cells and Photovoltaic Systems Engineering
Solutions Manual - Chapter 1
Problem 1.10
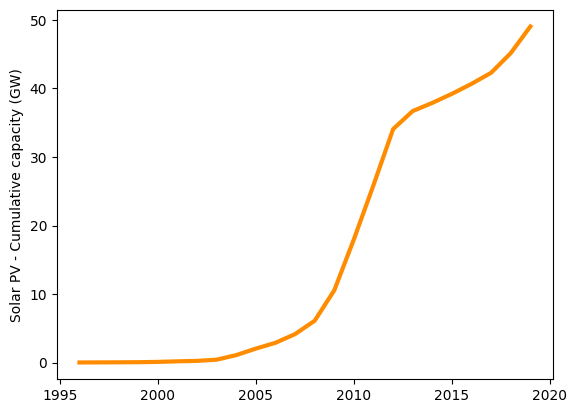
Most countries in the world are experiencing a fast ramp-up of the installed PV capacity. Select one country, look for data on the cumulative installed capacity of solar PV, and plot it as a function of time for at least the past decade.
To plot the evolution of cumulative PV capacity in a country, we can use the dataset included in the BP Statistical Review of World Energy
We will use the package matplotlib.pyplot to plot the results
import pandas as pd
import matplotlib.pyplot as plt
We start by importing the data and selectring the country. In this example, we will plot Germany.
datafile = pd.read_excel('data/bp-stats-review-2021-all-data.xlsx',
                              sheet_name='Solar Capacity',
                              index_col=0, header=0)

country = 'Germany' # select 'Total World' to plot global capacity

capacity=0.001*datafile.loc[country][0:24] #MW -> GW
capacity.index=[int(x) for x in datafile.loc['Megawatts'][0:24]]
We define the properties of the figure and plot it.
plt.plot(capacity,
         color='darkorange',
         linewidth=3)

plt.ylabel('Solar PV - Cumulative capacity (GW)')
Text(0, 0.5, 'Solar PV - Cumulative capacity (GW)')