
Problem 12.8#
Fundamentals of Solar Cells and Photovoltaic Systems Engineering
Solutions Manual - Chapter 12
Problem 12.8
For the spectra in Problem S12.7 and assuming that the lamps are located at the correct position, what is the error that is made at each of the nine 100 nm broadbands from 300 to 1200 nm for each of the lamps with respect to the solar spectrum?
We will use the package pandas to handle the data and matplotlib.pyplot to plot the results.
import pandas as pd
import numpy as np
import matplotlib.pyplot as plt
We start by importing the data for the solar spectra.
reference = pd.read_csv('data/Reference_spectrum_ASTM-G173-03.csv', index_col=0, header=0)
reference
| AM0 | AM1.5G | AM1.5D | |
|---|---|---|---|
| Wvlgth nm | Etr W*m-2*nm-1 | Global tilt W*m-2*nm-1 | Direct+circumsolar W*m-2*nm-1 |
| 280 | 8.20E-02 | 4.73E-23 | 2.54E-26 |
| 280.5 | 9.90E-02 | 1.23E-21 | 1.09E-24 |
| 281 | 1.50E-01 | 5.69E-21 | 6.13E-24 |
| 281.5 | 2.12E-01 | 1.57E-19 | 2.75E-22 |
| ... | ... | ... | ... |
| 3980 | 8.84E-03 | 7.39E-03 | 7.40E-03 |
| 3985 | 8.80E-03 | 7.43E-03 | 7.45E-03 |
| 3990 | 8.78E-03 | 7.37E-03 | 7.39E-03 |
| 3995 | 8.70E-03 | 7.21E-03 | 7.23E-03 |
| 4000 | 8.68E-03 | 7.10E-03 | 7.12E-03 |
2003 rows × 3 columns
reference.drop(reference.index[0], inplace=True)   # remove row including information on units
reference=reference.astype(float)                  # convert values to float for easy operation
reference.index=reference.index.astype(float)      # convert indexes to float for easy operation
We import the data for the Xe-arc lamp.
xe_arc = pd.read_csv('data/Xe lamp spectral irradiance.csv', index_col=0, header=0)
xe_arc
| Xe arc lamp (W*m-2*nm-1) | |
|---|---|
| wavelength (nm) | |
| 300.36966 | 0.000793 |
| 300.58005 | 0.000816 |
| 300.79044 | 0.000837 |
| 301.00082 | 0.000858 |
| 301.21124 | 0.000876 |
| ... | ... |
| 1199.77246 | 0.213920 |
| 1199.84302 | 0.213600 |
| 1199.91345 | 0.213280 |
| 1199.98401 | 0.212960 |
| 1200.05444 | 0.212640 |
6283 rows × 1 columns
We import the data for the quartz tungsten lamp.
quartz_w = pd.read_csv('data/W lamp spectral irradiance.csv', index_col=0, header=0)
quartz_w
| W halogen lamp (W*m-2*nm-1) | |
|---|---|
| wavelength (nm) | |
| 300 | 0.000001 |
| 301 | 0.000010 |
| 302 | 0.000100 |
| 303 | 0.000200 |
| 304 | 0.000300 |
| ... | ... |
| 1196 | 0.654304 |
| 1197 | 0.653941 |
| 1198 | 0.651544 |
| 1199 | 0.647531 |
| 1200 | 0.644677 |
901 rows × 1 columns
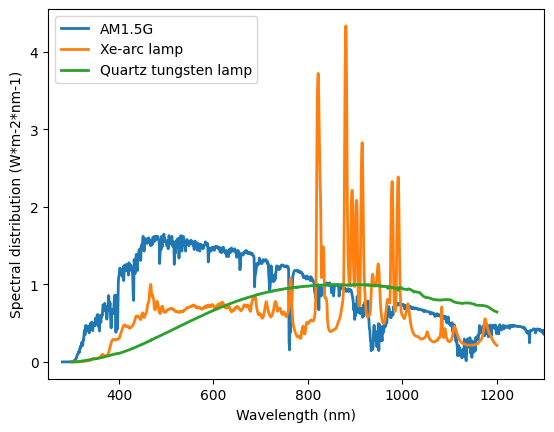
We can also plot the AM1.5G spectra, the Xe-arc lamp, and the quarz tungsten lamp spectra.
plt.plot(reference['AM1.5G'],
         linewidth=2, label='AM1.5G')
plt.plot(xe_arc,
         linewidth=2, label='Xe-arc lamp')
plt.plot(quartz_w,
         linewidth=2, label='Quartz tungsten lamp')
plt.ylabel('Spectral distribution (W*m-2*nm-1)')
plt.xlabel('Wavelength (nm)')
plt.xlim([250,1300])
plt.legend()
<matplotlib.legend.Legend at 0x7f63c48e2050>
We can calculate the total irradiance from every spectra in each 100 nm-bands from 300 to 1200 nm.
bands = np.array(np.arange(300,1300,100))
w=5
irradiance_bands = pd.DataFrame(columns=['AM1.5G', 'Xe arc lamp', 'Quartz W halogen lamp'])
AM15G=reference['AM1.5G']
Xe=xe_arc['Xe arc lamp (W*m-2*nm-1)']
Quartz_W=quartz_w['W halogen lamp (W*m-2*nm-1)']
for band in bands:
    AM15G_interpolated=np.interp(np.arange(band, band+100, w), AM15G.index, AM15G.values)
    irradiance_bands.loc[band,'AM1.5G'] = AM15G_interpolated.sum()*w

    Xe_interpolated=np.interp(np.arange(band, band+100, w), Xe.index, Xe.values)
    irradiance_bands.loc[band,'Xe arc lamp'] = Xe_interpolated.sum()*w

    Quartz_W_interpolated=np.interp(np.arange(band, band+100, w), Quartz_W.index, Quartz_W.values)
    irradiance_bands.loc[band,'Quartz W halogen lamp'] = Quartz_W_interpolated.sum()*w
irradiance_bands
| AM1.5G | Xe arc lamp | Quartz W halogen lamp | |
|---|---|---|---|
| 300 | 46.3471 | 7.745697 | 4.3254 |
| 400 | 137.925 | 59.513764 | 22.750901 |
| 500 | 151.4 | 68.860502 | 51.50123 |
| 600 | 140.4 | 71.229846 | 77.502158 |
| 700 | 111.44 | 58.938656 | 93.554867 |
| 800 | 95.685 | 118.622972 | 99.165299 |
| 900 | 56.28 | 112.40382 | 97.922396 |
| 1000 | 64.92 | 38.525673 | 85.919091 |
| 1100 | 31.3655 | 30.108108 | 74.070708 |
| 1200 | 43.635 | 21.265237 | 64.467675 |
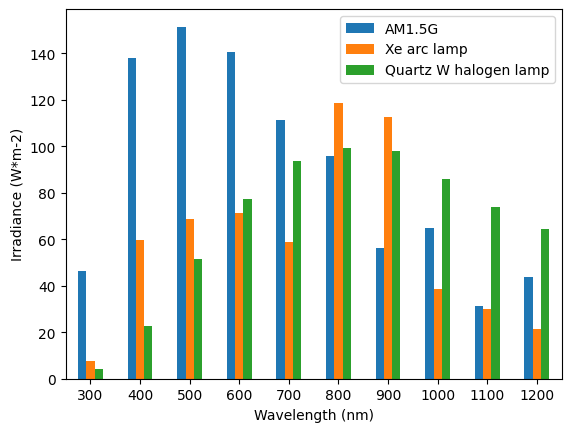
We can plot the total irradiance per band from the different lamps.
ax = irradiance_bands.plot.bar(rot=0)
plt.ylabel('Irradiance (W*m-2)')
plt.xlabel('Wavelength (nm)')
Text(0.5, 0, 'Wavelength (nm)')
We can also calculate the errors in percentage.
irradiance_bands['error Xe arc lamp'] = 100*(irradiance_bands['Xe arc lamp']/irradiance_bands['AM1.5G']-1)
irradiance_bands['error Quartz W halogen lamp'] = 100*(irradiance_bands['Quartz W halogen lamp']/irradiance_bands['AM1.5G']-1)

irradiance_bands
| AM1.5G | Xe arc lamp | Quartz W halogen lamp | error Xe arc lamp | error Quartz W halogen lamp | |
|---|---|---|---|---|---|
| 300 | 46.3471 | 7.745697 | 4.3254 | -83.287635 | -90.667377 |
| 400 | 137.925 | 59.513764 | 22.750901 | -56.850633 | -83.504875 |
| 500 | 151.4 | 68.860502 | 51.50123 | -54.517502 | -65.983335 |
| 600 | 140.4 | 71.229846 | 77.502158 | -49.266492 | -44.799033 |
| 700 | 111.44 | 58.938656 | 93.554867 | -47.111759 | -16.049114 |
| 800 | 95.685 | 118.622972 | 99.165299 | 23.97238 | 3.637246 |
| 900 | 56.28 | 112.40382 | 97.922396 | 99.722494 | 73.991465 |
| 1000 | 64.92 | 38.525673 | 85.919091 | -40.656696 | 32.346104 |
| 1100 | 31.3655 | 30.108108 | 74.070708 | -4.008838 | 136.153444 |
| 1200 | 43.635 | 21.265237 | 64.467675 | -51.265643 | 47.743038 |