
Problem 2.18#
Fundamentals of Solar Cells and Photovoltaic Systems Engineering
Solutions Manual - Chapter 2
Problem 2.18
Using pvlib-python and retrieving data from PVGIS:
(a) Calculate the average annual global horizontal irradiation at Montpellier, France (43°36′39″ N, 3°52′38″ E), from both satellite and reanalysis datasets.
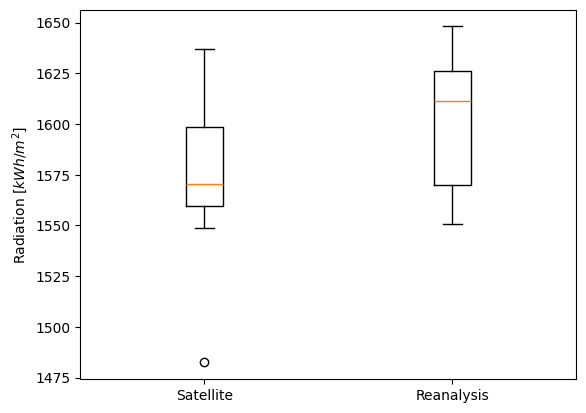
(b) Plot the interannual variability of annual global horizontal irradiation at the same location, from both satellite and reanalysis datasets.
We start by importing several packages that will be useful, including pandas and matplotlib.pyplot to plot the results.
import requests
import datetime as dt
from pathlib import Path
import matplotlib.pyplot as plt
from matplotlib import ticker
import pandas as pd
We define a function to retrieve data from PVGIS. More details regarding how to download data from PVGIS using an APi can be found in PVGIS API
def read_radiation_pvgis(raddatabase, lat, lon):
    params = {'lat': lat,
              'lon': lon,
              'browser': 1,
              'outputformat': 'csv',
              'raddatabase': raddatabase}

    series_file = Path(f'data/anual_series_{lat}_{lon}_{raddatabase}.csv')

    if not series_file.exists():
        resp_series = requests.get('https://re.jrc.ec.europa.eu/api/v5_2/seriescalc', params=params)
        with open(series_file, 'wb') as f:
            f.write(resp_series.content)

    series = pd.read_csv(series_file,
                         skiprows=8,
                         index_col='time',
                         skipfooter=10,
                         engine='python',
                         parse_dates=True,
                         date_format='%Y%m%d:%H%M'
                         )

    series = series.rename({'G(i)': 'ghi'}, axis='columns')
    series['hour'] = series.index.hour
    series['date'] = series.index.date

    return series
We start by defining the location.
latitude, longitude = 43.6, 3.87 # Montpellier, France
We retrieve all the available data corresponding to the radiation database equal to satellite data (SARAH2) and calculate the average.
satellite = read_radiation_pvgis(raddatabase='PVGIS-SARAH2', lat=latitude, lon=longitude)
num_years = len(satellite.index.year.unique())
print(f'{num_years} years of data available')
print(f'Average satellite anual irradiation = {round(satellite.ghi.sum()/1000 / num_years,1)} kWh/m2')
16 years of data available
Average satellite anual irradiation = 1577.5 kWh/m2
We retrieve all the available data corresponding to the radiation database equal to climate reanalysis data (ERA5) and calculate the average.
reanalysis = read_radiation_pvgis(raddatabase='PVGIS-ERA5', lat=latitude, lon=longitude)
num_years = len(reanalysis.index.year.unique())
print(f'{num_years} years of data available')
print(f'Average reanalysis anual irradiation = {round(reanalysis.ghi.sum()/1000 / num_years,1)} kWh/m2')
16 years of data available
Average reanalysis anual irradiation = 1601.1 kWh/m2
We calculate the annual values for the two data sources.
ghi_satellite_year = satellite['ghi'].resample('YE').sum() /1000 # kWh
ghi_reanalysis_year = reanalysis['ghi'].resample('YE').sum() /1000 # kWh
And plot them.
plt.boxplot([ghi_satellite_year, ghi_reanalysis_year])
plt.ylabel('Radiation [$kWh/m^2$]')
plt.xticks([1, 2], ['Satellite', 'Reanalysis'])
([<matplotlib.axis.XTick at 0x7fe179a93d10>,
  <matplotlib.axis.XTick at 0x7fe17b962710>],
 [Text(1, 0, 'Satellite'), Text(2, 0, 'Reanalysis')])
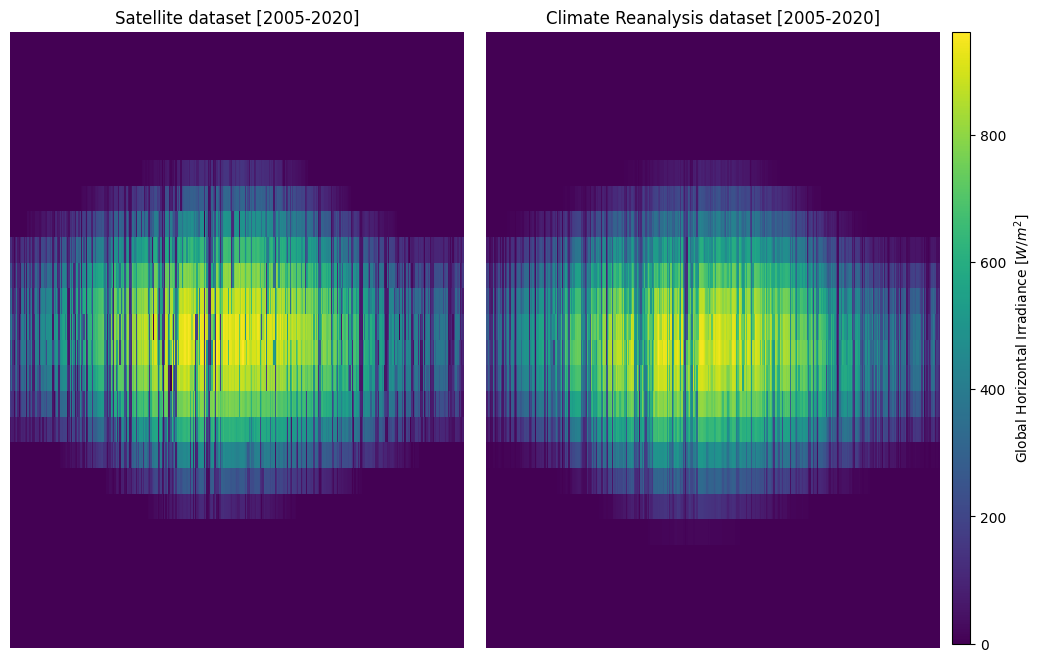
We can also plot a colormap showing the hourly values throughout the year.
YEAR = 2010

satellite_1year = satellite[satellite.index.year == YEAR]
reanalysis_1year = reanalysis[reanalysis.index.year == YEAR]

fig, (ax_satellite_1year, ax_reanalysis_1year) = plt.subplots(nrows=1,
                                                              ncols=2,
                                                              figsize=(12, 8),
                                                              sharey=True,
                                                              squeeze=True)
plt.subplots_adjust(wspace=0.05)

ax_satellite_1year.pcolormesh(satellite_1year.pivot_table(values='ghi',
                                                               index='hour',
                                                               columns='date',
                                                               fill_value=0))
ax_satellite_1year.axis('off')
ax_satellite_1year.set_title('Satellite dataset [2005-2020]')
im = ax_reanalysis_1year.pcolormesh(reanalysis_1year.pivot_table(values='ghi',
                                                                 index='hour',
                                                                 columns='date',
                                                                 fill_value=0))
ax_reanalysis_1year.axis('off')
ax_reanalysis_1year.set_title('Climate Reanalysis dataset [2005-2020]')
cbar_ax = fig.add_axes([0.91, 0.115, 0.015, 0.765])
fig.colorbar(im, cax=cbar_ax, label='Global Horizontal Irradiance [$W/m^2$]')
<matplotlib.colorbar.Colorbar at 0x7fe17db3a110>
We can also calculate the normalized standard deviation for the annual global horizontal irradiance.
satellite_mean = ghi_satellite_year.mean()
satellite_std_n = 100 * ghi_satellite_year.std() / ghi_satellite_year.mean()

print(f'Average satellite anual irradiation = {round(satellite_mean)} kWh/m2')
print(f'Normalized standard deviation for satellite anual irradiation = {round(satellite_std_n,1)} %')
Average satellite anual irradiation = 1577 kWh/m2
Normalized standard deviation for satellite anual irradiation = 2.3 %
reanalysis_mean = ghi_reanalysis_year.mean()
reanalysis_std_n = 100 * ghi_reanalysis_year.std() / ghi_reanalysis_year.mean()

print(f'Average reanalysis anual irradiation = {round(reanalysis_mean)} kWh/m2')
print(f'Normalized standard deviation for reanalysis anual irradiation = {round(reanalysis_std_n,1)} %')
Average reanalysis anual irradiation = 1601 kWh/m2
Normalized standard deviation for reanalysis anual irradiation = 2.0 %