
Problem 2.19#
Fundamentals of Solar Cells and Photovoltaic Systems Engineering
Solutions Manual - Chapter 2
Problem 2.19
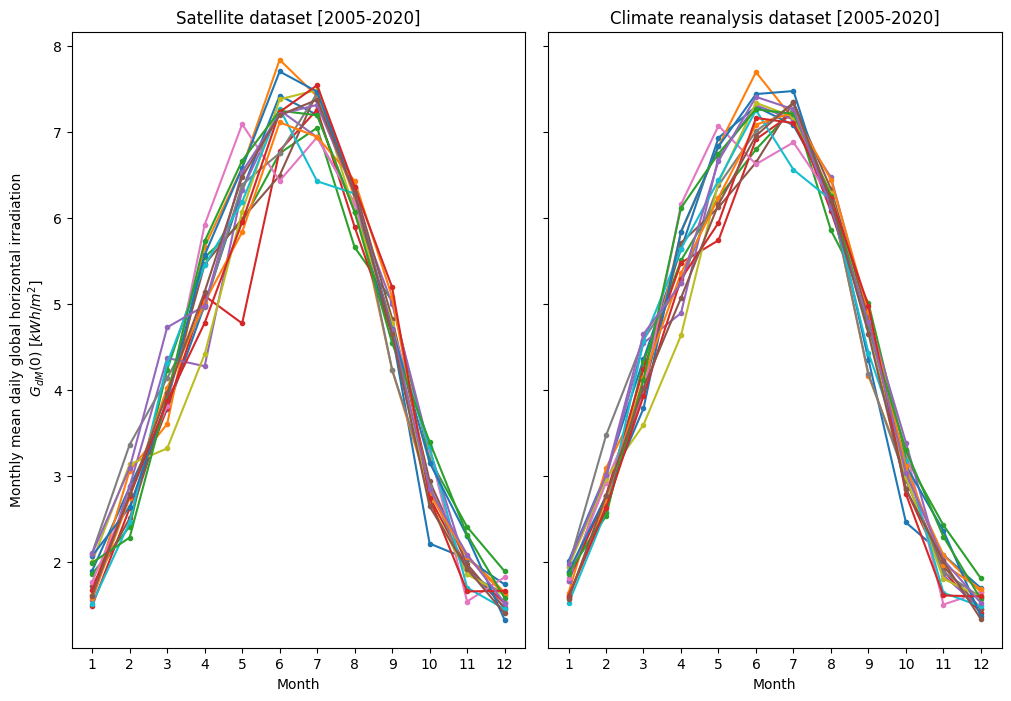
Using pvlib-python and retrieving data from PVGIS, calculate the monthly mean of the daily horizontal irradiation \(G_{dM}(0)\) at Montpellier, France (43°36′39″ N, 3°52′38″ E), from both satellite and climate reanalysis datasets. Do the calculation for every year included in the datasets and plot the results.
We start by importing several packages that will be useful, including pandas and matplotlib.pyplot to plot the results.
import requests
from pathlib import Path
import matplotlib.pyplot as plt
from matplotlib import ticker
import pandas as pd
We define a function to retrieve data from PVGIS. More details regarding how to download data from PVGIS using an APi can be found in PVGIS API
def read_radiation_pvgis(raddatabase, lat, lon):
    params = {'lat': lat,
              'lon': lon,
              'browser': 1,
              'outputformat': 'csv',
              'raddatabase': raddatabase}

    series_file = Path(f'data/anual_series_{lat}_{lon}_{raddatabase}.csv')

    if not series_file.exists():
        resp_series = requests.get('https://re.jrc.ec.europa.eu/api/v5_2/seriescalc', params=params)
        with open(series_file, 'wb') as f:
            f.write(resp_series.content)

    series = pd.read_csv(series_file,
                         skiprows=8,
                         index_col='time',
                         skipfooter=10,
                         engine='python',
                         parse_dates=True,
                         date_format='%Y%m%d:%H%M')

    series = series.rename({'G(i)': 'ghi'}, axis='columns')
    series['hour'] = series.index.hour

    return series
We start by defining the location.
latitude, longitude = 43.6, 3.87 # Montpellier, France
satellite = read_radiation_pvgis(raddatabase='PVGIS-SARAH2', lat=latitude, lon=longitude)
reanalysis = read_radiation_pvgis(raddatabase='PVGIS-ERA5', lat=latitude, lon=longitude)
We calculate the monthly mean of the daily horizontal irradiation \(G_{dM}(0)\) for the two datasets.
satellite_days = satellite.resample('D').sum() /1000 # kWh
satellite_month_series = satellite_days.pivot_table(values='ghi',
                                                    index=satellite_days.index.month,
                                                    columns=satellite_days.index.year)

reanalysis_days = reanalysis.resample('D').sum() /1000 # kWh
reanalysis_month_series = reanalysis_days.pivot_table(values='ghi',
                                                      index=reanalysis_days.index.month,
                                                      columns=reanalysis_days.index.year)
And we plot \(G_{dM}(0)\) for the different years included in both datasets.
fig, (ax_satellite, ax_reanalysis) = plt.subplots(nrows=1, ncols=2, figsize=(12, 8), sharey=True, squeeze=True)
plt.subplots_adjust(wspace=0.05)

satellite_month_series.plot(ax=ax_satellite, style='.-')
ax_satellite.xaxis.set_major_locator(ticker.MultipleLocator(1))
ax_satellite.set_xlabel('Month')
ax_satellite.set_ylabel('Monthly mean daily global horizontal irradiation\n $G_{dM}(0)$ [$kWh/m^2]$')
ax_satellite.set_title('Satellite dataset [2005-2020]')
ax_satellite.get_legend().remove()

reanalysis_month_series.plot(ax=ax_reanalysis, style='.-')
ax_reanalysis.xaxis.set_major_locator(ticker.MultipleLocator(1))
ax_reanalysis.set_xlabel('Month')
ax_reanalysis.set_title('Climate reanalysis dataset [2005-2020]')
ax_reanalysis.get_legend().remove()
# std/mean [%] : μ±1σ [68% of monthly interannual deviation explained in the interval]
print('Monthly interannual deviation for reanalysis data')
print(round(reanalysis_month_series.std(axis='columns') / reanalysis_month_series.mean(axis='columns') * 100,2))

print('Monthly interannual deviation for satellite data')
print(round(satellite_month_series.std(axis='columns') / satellite_month_series.mean(axis='columns') * 100))
Monthly interannual deviation for reanalysis data
time
1      9.33
2      8.66
3      7.42
4      7.63
5      5.86
6      4.16
7      2.96
8      2.32
9      5.57
10     7.64
11    13.20
12     8.41
dtype: float64
Monthly interannual deviation for satellite data
time
1     12.0
2     10.0
3      8.0
4      9.0
5      8.0
6      6.0
7      4.0
8      3.0
9      6.0
10    11.0
11    12.0
12    10.0
dtype: float64