
Introduction to networkx#
Note
This material is mostly adapted from the following resources:
NetworkX: Network Analysis in Python
NetworkX is a Python package for the creation, manipulation, and study of the structure, dynamics, and functions of complex networks.
Main features:
Data structures for graphs
Many standard graph algorithms
Network structure and analysis measures
Note
Documentation for this package is available at https://networkx.github.io/.
Note
If you have not yet set up Python on your computer, you can execute this tutorial in your browser via Google Colab. Click on the rocket in the top right corner and launch “Colab”. If that doesn’t work download the .ipynb file and import it in Google Colab.
Then install the following packages by executing the following command in a Jupyter cell at the top of the notebook.
!pip install numpy networkx pandas matplotlib
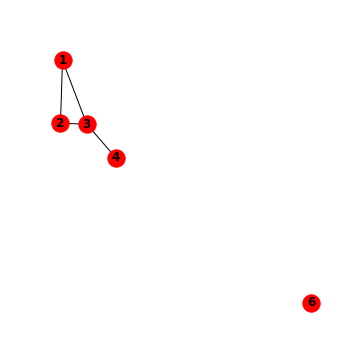
Let’s perform some network analysis on this simple graph:
Network Analysis with numpy.#
import numpy as np
Say we want to calculate the so-called Laplacian \(L\) of this graph based on its incidence
matrix \(K\), which is an \(N\times N\) matrix defined as \(L=KK^\top\) for an
undirected graph. The Laplacian matrix of a graph is a representation that
captures the connectivity and structure of the graph by quantifying the
difference between the degree of each vertex and the adjacency relationships
with its neighbouring vertices. We first need to write down the incidence matrix
\(K\) as a np.array. Let’s also use the convention that edges are oriented such
that they are directed at the node with the higher label value (i.e. from node 1
to node 2, not vice versa).
K = np.array(
    [
        [1, -1, 0, 0],
        [1, 0, -1, 0],
        [0, 1, -1, 0],
        [0, 0, 1, -1],
    ]
).T
K
array([[ 1,  1,  0,  0],
       [-1,  0,  1,  0],
       [ 0, -1, -1,  1],
       [ 0,  0,  0, -1]])
L = K.dot(K.T)
L
array([[ 2, -1, -1,  0],
       [-1,  2, -1,  0],
       [-1, -1,  3, -1],
       [ 0,  0, -1,  1]])
This is all fine for small graphs, but inconvient for larger graphs. Let’s take the help some Python packages have to offer…
Making our life easier with networkx#
First, let’s import the library. It is commonly imported under the alias nx.
import networkx as nx
This is how we can create an empty graph with no nodes and no edges.
G = nx.Graph()
Nodes#
We can add one node at a time,
G.add_node(1)
with attributes
G.add_node(2, country="DE")
or add nodes from a list
G.add_nodes_from([3, 4])
We can also add nodes along with node attributes if your container yields 2-tuples of the form (node, node_attribute_dict):
G.add_nodes_from(
    [
        (5, {"color": "red"}),
        (6, {"color": "green"}),
    ]
)
Links (which are also called Edges)#
G can also be grown by adding one edge at a time,
G.add_edge(1, 2)
even with attributes
G.add_edge(3, 4, weight=2)
or by adding a list of edges,
G.add_edges_from([(1, 3), (2, 5)])
or as a 3-tuple with 2 nodes followed by an edge attribute dictionary
G.add_edges_from([(2, 3, {"weight": 3})])
Examining elements of a graph#
We can examine the nodes and edges.
G.nodes
NodeView((1, 2, 3, 4, 5, 6))
G.number_of_nodes()
6
G.edges
EdgeView([(1, 2), (1, 3), (2, 5), (2, 3), (3, 4)])
G.number_of_edges()
5
Accessing graph elements#
Access an edge:
G.edges[2, 3]
{'weight': 3}
Access an attribute of an edge:
G.edges[2, 3]["weight"]
3
Find all neighbours of node 1:
G[1]
AtlasView({2: {}, 3: {}})
Removing elements#
One can remove nodes and edges from the graph in a similar fashion to adding. Use methods G.remove_node(), G.remove_nodes_from(), G.remove_edge() and G.remove_edges_from(), e.g.
G.remove_node(5)
G.remove_edge(2, 5)
---------------------------------------------------------------------------
KeyError                                  Traceback (most recent call last)
File /opt/hostedtoolcache/Python/3.11.12/x64/lib/python3.11/site-packages/networkx/classes/graph.py:1134, in Graph.remove_edge(self, u, v)
   1133 try:
-> 1134     del self._adj[u][v]
   1135     if u != v:  # self-loop needs only one entry removed

KeyError: 5

The above exception was the direct cause of the following exception:

NetworkXError                             Traceback (most recent call last)
Cell In[23], line 1
----> 1 G.remove_edge(2, 5)

File /opt/hostedtoolcache/Python/3.11.12/x64/lib/python3.11/site-packages/networkx/classes/graph.py:1138, in Graph.remove_edge(self, u, v)
   1136         del self._adj[v][u]
   1137 except KeyError as err:
-> 1138     raise NetworkXError(f"The edge {u}-{v} is not in the graph") from err
   1139 nx._clear_cache(self)

NetworkXError: The edge 2-5 is not in the graph
NB: Removing a node will also remove all adjacent edges!
You can remove all nodes and edges with
# G.clear()
Visualising graphs#
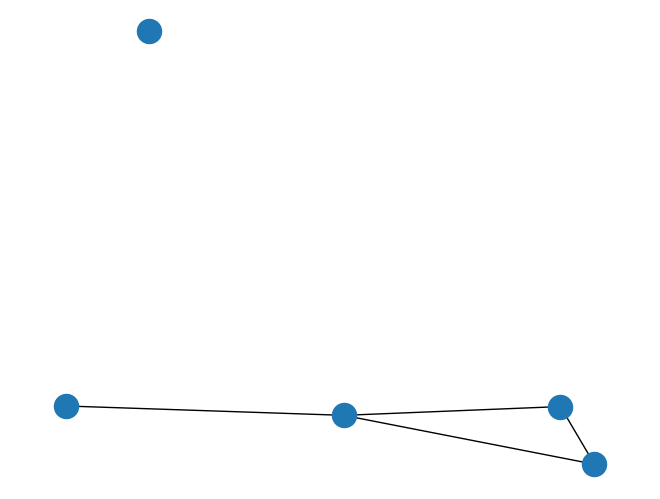
A basic drawing function for networks is also available in networkx
nx.draw(G)
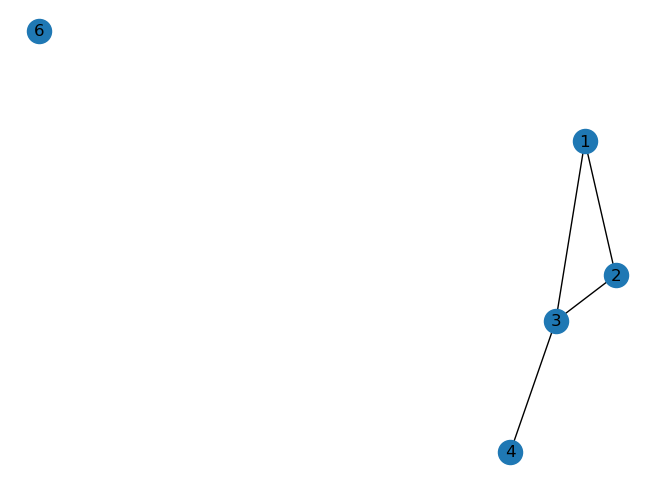
with options for labeling graph elements
nx.draw(G, with_labels=True)
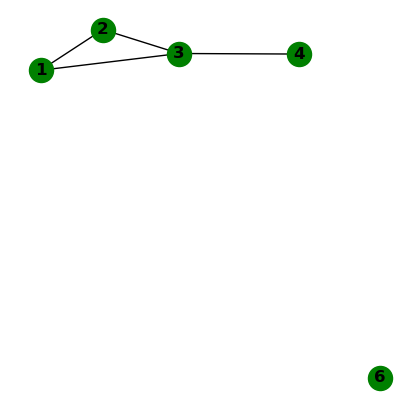
and integration to matplotlib
import matplotlib.pyplot as plt

fig, ax = plt.subplots(figsize=(5, 5))
nx.draw(G, with_labels=True, ax=ax, node_color="green", font_weight="bold")
plt.savefig("tmp.png")
Note
For a full list of arguments of the function see https://networkx.org/documentation/stable/reference/generated/networkx.drawing.nx_pylab.draw_networkx.html
Analysing graphs#
The networkx library comes with many functions to analyse graphs. Here are a few examples that we can use for linearised power flow calculations in electricity transmission networks:
Are all nodes in the network connected with each other?
nx.is_connected(G)
False
What are the components that are connected / isolated?
list(nx.connected_components(G))
[{1, 2, 3, 4}, {6}]
Is the network planar? I.e. can the graph be drawn such that edges don’t cross?
nx.is_planar(G)
True
What is the frequency of degrees in the network?
nx.degree_histogram(G)
[1, 1, 2, 1]
import pandas as pd

pd.Series(nx.degree_histogram(G))
0    1
1    1
2    2
3    1
dtype: int64
What is the adjacency matrix? (Careful, networkx will yield a weighted adjacency matrix by default!)
A = nx.adjacency_matrix(G, weight=None).todense()
A
array([[0, 1, 1, 0, 0],
       [1, 0, 1, 0, 0],
       [1, 1, 0, 1, 0],
       [0, 0, 1, 0, 0],
       [0, 0, 0, 0, 0]])
What is the incidence matrix? (Careful, networkx will yield a incidence matrix without orientation by default!)
nx.incidence_matrix(G, oriented=True).todense()
array([[-1., -1.,  0.,  0.],
       [ 1.,  0., -1.,  0.],
       [ 0.,  1.,  1., -1.],
       [ 0.,  0.,  0.,  1.],
       [ 0.,  0.,  0.,  0.]])
What is the Laplacian matrix? (Careful, networkx will yield a weighted adjacency matrix by default!)
L = nx.laplacian_matrix(G, weight=None).todense()
L
array([[ 2, -1, -1,  0,  0],
       [-1,  2, -1,  0,  0],
       [-1, -1,  3, -1,  0],
       [ 0,  0, -1,  1,  0],
       [ 0,  0,  0,  0,  0]], dtype=int32)
Find a cycle basis (i.e. a collection of independent cycles through which all other cycles can be represented through linear combination):
nx.cycle_basis(G)
[[1, 2, 3]]
This function returns a list of sequences. Each sequence indicates a series of nodes to traverse for the respective cycle.